
Talking today about race is polarizing, to say the least. And I enter the fray with caution. There have been many valid points, from over-criminalization to the over-militarization of police, from the high rates of lead poisoning in Baltimore to the meditations on dreams deferred.
But there’s one point that I haven’t heard, that I think could help explain part of the chasm between the two sides on this issue, and I hope that highlighting its role can help explain why our perceptions differ so much. This could then serve as a starting point for agreement in a place where compromise seems difficult.*
If racism is a poison, it is more like nuclear radiation than lead: even a small dose of it causes serious, immediate harm, and its effects last generations. Or, to use a more old-fashioned metaphor, a little bit of leaven leavens the whole lump.
Take an incident at Harvard in 2007 in which police came to check on an activity hosted by black students during reading period. They had been called – whether because of a “noise disturbance complaint” or because some residents thought that certain “students looked like they didn’t belong” – and left after the organizers showed them their permit to host the event. There was an email thread – to which I am not privy – that shared similar concerns. I honestly don’t know enough to say whether it was racially-motivated or not, but that’s not my point in this post.
Let’s assume it was racially motivated. It takes just 1 call to the police (maybe 5 emails from students) for dozens of black students to experience racism. There are over 360 people in Cabot House. Even if less than 2% of those people are racist, dozens of people will experience racism.
That’s not to justify the racism, or to suggest that it’s not a problem. Take another problem facing a smaller portion of our society: homelessness. A lot of people think that homelessness works like a bell curve. Most people might be homeless for a few weeks, but most will find a home within a week or within a few months. This perception is totally wrong. The real graph looks more like this**:

The actual curve is actually more like a hockey stick. Most people who are homeless are homeless for a very short period of time, with a small but significant portion staying homeless for a long time. The cost of homelessness actually looks like a hockey stick in the opposite direction. Under a bell curve, you would expect that most costs would go toward paying for people near the mean. Instead, most costs go toward paying for the small number of chronically homeless people.

Even though the area under the curves is similar (meaning they would cost the state approximately the same), the source of the cost is totally different. Under a bell curve, most of the cost comes from individuals equally distributed. Under a hockey stick curve, most of the cost comes from a few chronically homeless individuals. This is why solutions like the one proposed in Utah, which seek to house the chronically homeless, have proven cost-effective: it’s cheaper to give each one a caseworker and an apartment than to keep shuttling them in and out of the hospital.
Saying that the source of the cost is actually a smaller number of people is not to minimize the very real cost of homelessness to our society, but it is to come one step closer to finding a solution.
I suspect people are so polarized because when they think about problems like this, they imagine that they follow a typical bell curve. We think that if 50% of black people assert that they’ve had a racist experience with a cop, then they’re saying roughly 50% of cops are racist. This doesn’t match with the white experience, so we’re inclined to reject it out of hand. But if it’s a hockey stick instead of a bell, that means that it could take only 2% of cops being racist for 50% of blacks to experience racism first or second-hand at the hands of the police. A small number of bad cops cause a disproportionate number of racist incidents.
Imagine that the curve is like this instead:
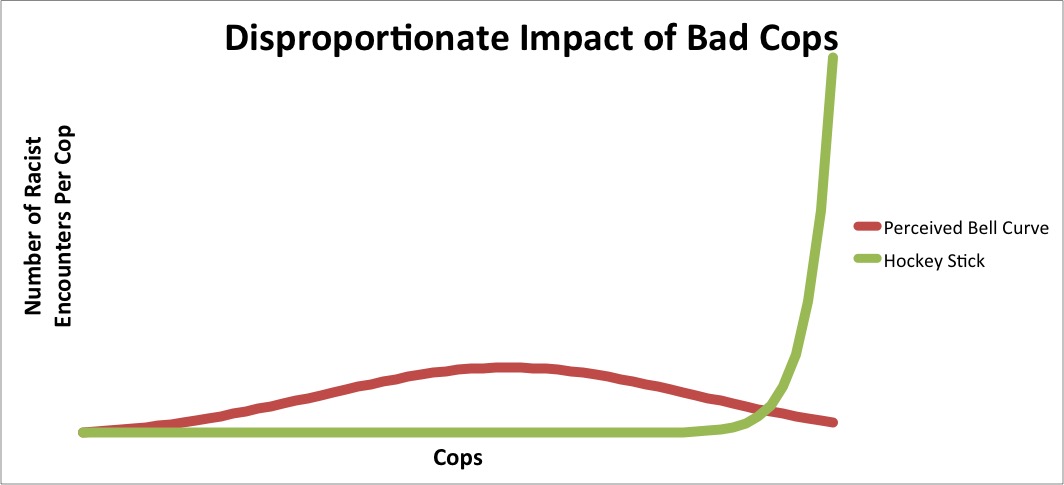 The areas under the curve are similar: a large number of people experience racism. But in one, the racism is widespread and equally distributed. In the other, a small percentage of bad cops have a hugely disproportionate impact in creating lots of racist encounters.
Malcolm Gladwell says that research discovered the same thing in investigations of the LAPD after Rodney King: “People thought it was a kind of institution-wide problem. Until you look very closely at the incidents of complaints against officers. And what you discover is a small number of officers account for an overwhelming percentage of the complaints against the LAPD. The average cop in the LAPD is fine.”
It may seem callous in a time when so many are hurting, when thousands are marching and looting, to talk about statistics. Yet I think in these statistics could lie our hope for a form of reconciliation.
In these numbers, we see how both perspectives can be right at the same time. Blacks are right that they are disproportionately being singled out by police and are regularly experiencing racism. Yet whites are also right that many people are not racist and many police officers are respectable, upstanding members of society. Both sides are probably mis-estimating – either on the number of bad cops (or bad departments) or on the amount of racism actually experienced.
Many of my white peers are loathe to start prosecuting police more, because they recognize how difficult it is to be a police officer and they respect that imperfect decisions can be made in the heat of a life-threatening situation. If the situation in Baltimore and Ferguson is anything like the situation in Los Angeles, however, greater accountability of the police will not lead to significant changes for most police officers. It will simply mean a weeding out of the few bad apples who are causing most of the problems.
___
* I know from my friends that many will say that this doesn’t go far enough. It doesn’t deal with the real forms of institutionalized racism, aesthetic stigma, or historical racism that can only have amends made via reparations. And I’m willing to listen to those conversations. But we’re so polarized that I doubt either side would simply consent to the demands of the other. I’m trying to stake out here something that I think both sides could easily agree on.
** I am not a statistician. If you have any suggestions for how to explain this better, or a better way to title the graphs, please let me know. If you are a statistician, I would encourage you to do real research on this! My numbers are, admittedly, a back of the envelope estimation. Getting real numbers here would help.

I read your 2013 article at: http://www.christianitytoday.com/ct/2013/march/atheists-dilemma.html?start=3
Your conversion process seemed somewhat relevant to mine, except mine went in reverse as I went from being a Christian in youth (thinking of Jesus as God/etc) to eventually become an agnostic (for lack of a better term), I even went through the entire depression ordeal too, so I know what that can be like.
It is strange that that exploration can lead to completely opposite results. I’m not writing to de-convert, but rather am interested that you found a way to believe in what I no longer do – as it did once feel comforting and I miss that aspect of it. Heck, I still read the Bible even though I seem incapable of believing in Jesus as divinity, or more so than any other living being. Going from Christian to not, the hardest part was finally admitting to yourself you don’t actually believe in the magical parts of the story – honesty, and then letting go of still wanting or wishing it to be real.
Given that Thomas is at the top of your page I presume it’s still going strong for you. Good luck!